
The Costs of Cutting School Spending

State budgets are in trouble due to the Covid-19 pandemic, with tax revenues in freefall and steep increases in spending on unemployment insurance, social-welfare programs, and emergency services. That spells budget trouble for schools, since states contribute about half of all public-school funding nationwide.
How might cuts to state education spending affect student achievement? We can learn something about what’s ahead by looking at education spending and student outcomes after the Great Recession, which began in late 2007 and ended in June 2009. The years immediately following that period represented the largest and most sustained decline in national per-pupil spending in more than a century. Spending fell by roughly 7 percent on average nationwide, by more than 10 percent in seven states, and by more than 20 percent in two states. The sheer magnitude of this historical episode allows us to examine whether large-scale and persistent education budget cuts harm students in general and poor children in particular.
We look at each state’s test scores and number of college freshmen from 2002 to 2017 to compare those outcomes before and after the funding cuts induced by the recession. To understand the causal effects of the cuts, we take advantage of the fact that the recession did not affect education spending in all states equally. Spending fell more in states where, prior to the recession, schools depended more on state funds. Yet those states were no more likely to experience high unemployment or poverty rates during the recession. This enables us to separate the effects of recession-induced cuts in school spending from the broader effects of the recession itself.
We find that, by and large, money matters. On average, a $1,000 reduction in per-pupil spending reduces average test scores in math and reading by 3.9 percent of a standard deviation and increases the score gap between black and white students by roughly 6 percent. A $1,000 reduction also lowers the college-going rate by about 2.6 percent. Declines in test scores and college-going tracked the recession-induced decline in per-pupil spending and did not abate as the economy recovered—providing further evidence that the declines are driven by spending changes rather than other effects of the recession.
Tracing the Impact of State Budgets
The relationship between education spending and learning outcomes has been a matter of debate for decades. In the search for a cause of the persistent gap in academic achievement between wealthy and poor students, budget disparities are a frequent nominee. Advocates for poor students have used this argument to overturn school-funding formulas that relied on local dollars in favor of state-based funding mechanisms, based on the assumption that state funding would direct more dollars to low-income communities and bring per-pupil spending up to equitable levels.
This move brought school spending in some poor communities in line with that of wealthier districts, and it has contributed to better outcomes for students, such as higher high-school graduation rates and adult wages (see “Boosting Educational Attainment and Adult Earnings,” research, fall 2015). But it has also made education budgets more vulnerable to overall economic conditions. State-collected revenues are based largely on income and sales taxes, which are more responsive to market fluctuations than federal revenues or local property-tax collections. In addition, more than half of all U.S. states have to balance their budgets every year. This means that when more residents qualify for state-funded assistance like Medicaid, education may get a smaller share of the budget.
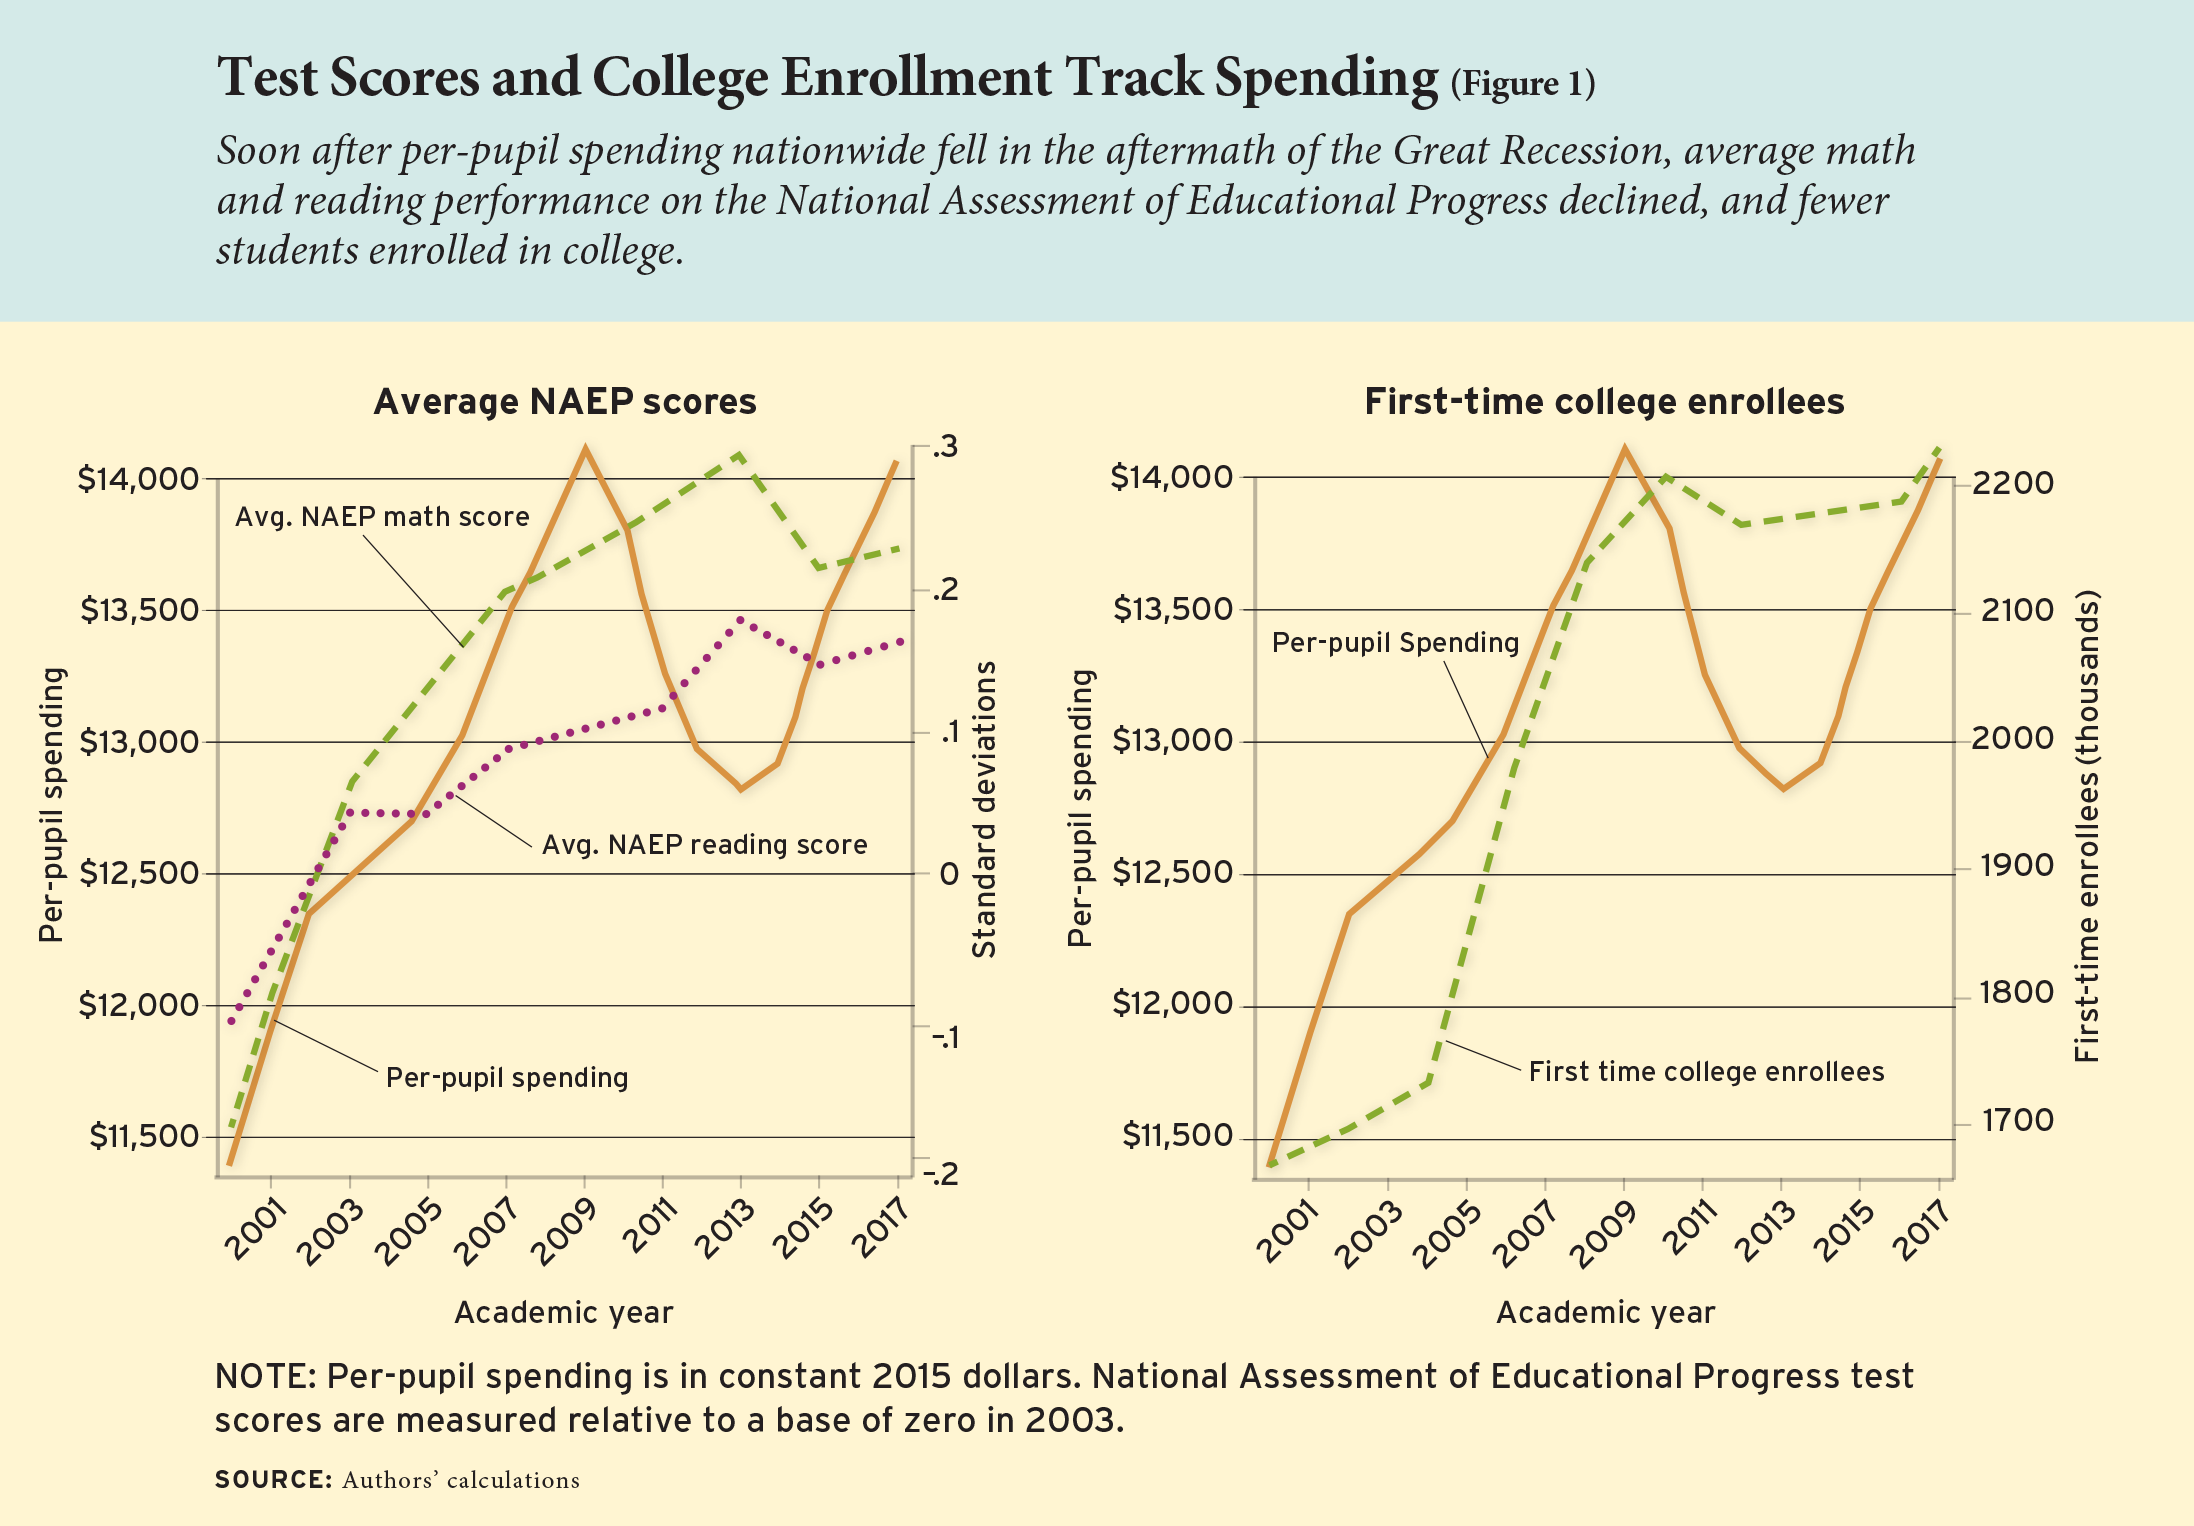
These dynamics were evident during the Great Recession, when real pre-tax income fell by almost 7 percent and national consumption as a percentage of gross domestic product fell by 6 percentage points. This led to a historic decline in per-pupil spending, which coincided with the first nationwide declines in test scores in more than 50 years as well as a smaller number of first-time college entrants (see Figure 1).
These concurrent trends are highly suggestive, but they may not reflect causal relationships. A particular concern is that it is changes in families’ economic circumstances due to the recession, not reductions in school spending, that account for the decline in outcomes. Our analysis below aims to separate the effect of recession-induced school spending declines from that of the recession itself.
Data
We link information from several data sources. School finance data come from the U.S. Census Bureau’s Annual Survey of School System Finances, which contains financial data for all 13,500 public school districts in the United States. On average, roughly 85 percent of all K–12 education spending goes to current spending—expenses for instruction and support services delivered that year. About 10 percent goes towards capital expenses, which include construction, land, and equipment. Employee salary and benefits are the largest single budget item, accounting for 67 percent of total spending.
The revenue sources for public education spending differ substantially by state, with varying mixes of state, local, and federal revenues. Between 2002 and 2017, some 48.7 percent of school revenue nationwide was from state funding, 41.7 percent was from local sources, and 9.5 percent was from federal funding. These percentages differ dramatically from state to state: the share of funding that comes from state sources ranges from 32 percent in Nebraska to 85 percent in Hawaii.
Test score data come from the National Assessment of Educational Progress, also known as the “Nation’s Report Card,” a test given every two years to a representative sample of students across the country. For our analysis, we use publicly available statewide average scores in reading and math, focusing on results for public school students in grades 4 and 8. These scores are based on the test results of 4.3 million individual students from 11,477 school districts between 2002 and 2017.
Our college-going data are from the Integrated Postsecondary Education Data System, based on surveys submitted by postsecondary institutions. Institutions report on the number of first-time college freshman from each state in each year. We use these reports to count the number of first-time freshmen from each state in each year. To compute college-going rates for these years, we obtain population counts by age in each state in each year from the U.S. Census Bureau. Our college-going measure is the number of first-time college enrollees divided by the average of the number of 17-year-olds and 18-year-olds in the state the year before enrollment. We use additional data on postsecondary institutions to compute college-going rates by school type, such as two- and four-year schools.
We also consider rates of poverty, employment and unemployment, average wages, and average home values as additional variables. These data are from a variety of sources, including the United States Census Bureau Small Area Income and Poverty Estimates, Bureau of Labor Statistics, and Zillow. School district staffing and student enrollment information come from the National Center for Education Statistics.
Method
In order to determine the effect of school spending levels on student outcomes, we need to identify the effect of recession-induced spending declines separate from the effect of the recession itself. We do this by looking at states that relied heavily on state funding for local education budgets before the recession. Those states were more likely to experience declines in school spending for reasons unrelated to the intensity of the recession in the state or other policy changes that may have occurred at that time. This basic pattern holds true for two related, but distinct, reasons.
First, as the labor market worsened, demand for state-funded services such as unemployment insurance and Medicaid increased. To cover these additional costs, many states cut their education budgets—a crowd-out effect. Before the Great Recession, states spent about 27 percent of their budgets on K–12 education. After 2009, that fell to about 23 percent, on average, where it remained through 2015. Looking back, we see a similar pattern during the recession in the early 2000s, when the share of state spending going to K–12 schools fell to about 27 percent from about 29 percent. This suggests that, even if state revenues were unchanged during the recession, states that were more reliant on state taxes to fund K–12 schools would be more likely to experience education budget cuts.
The second reason is related to the tax base for state funding. In general, state tax collections are more sensitive to economic conditions than local taxes. State taxes mostly come from income and sales tax collections, which are directly tied to residents’ paychecks and spending. By contrast, local tax collections are mostly from property taxes, which tend to be more stable even when market values fall. The greater sensitivity of state taxes to the business cycle suggests that, even if there were no crowd-out channel, states that were more reliant on state taxes to fund K–12 schools would experience deeper education budget cuts. We refer to this as the revenue effect.
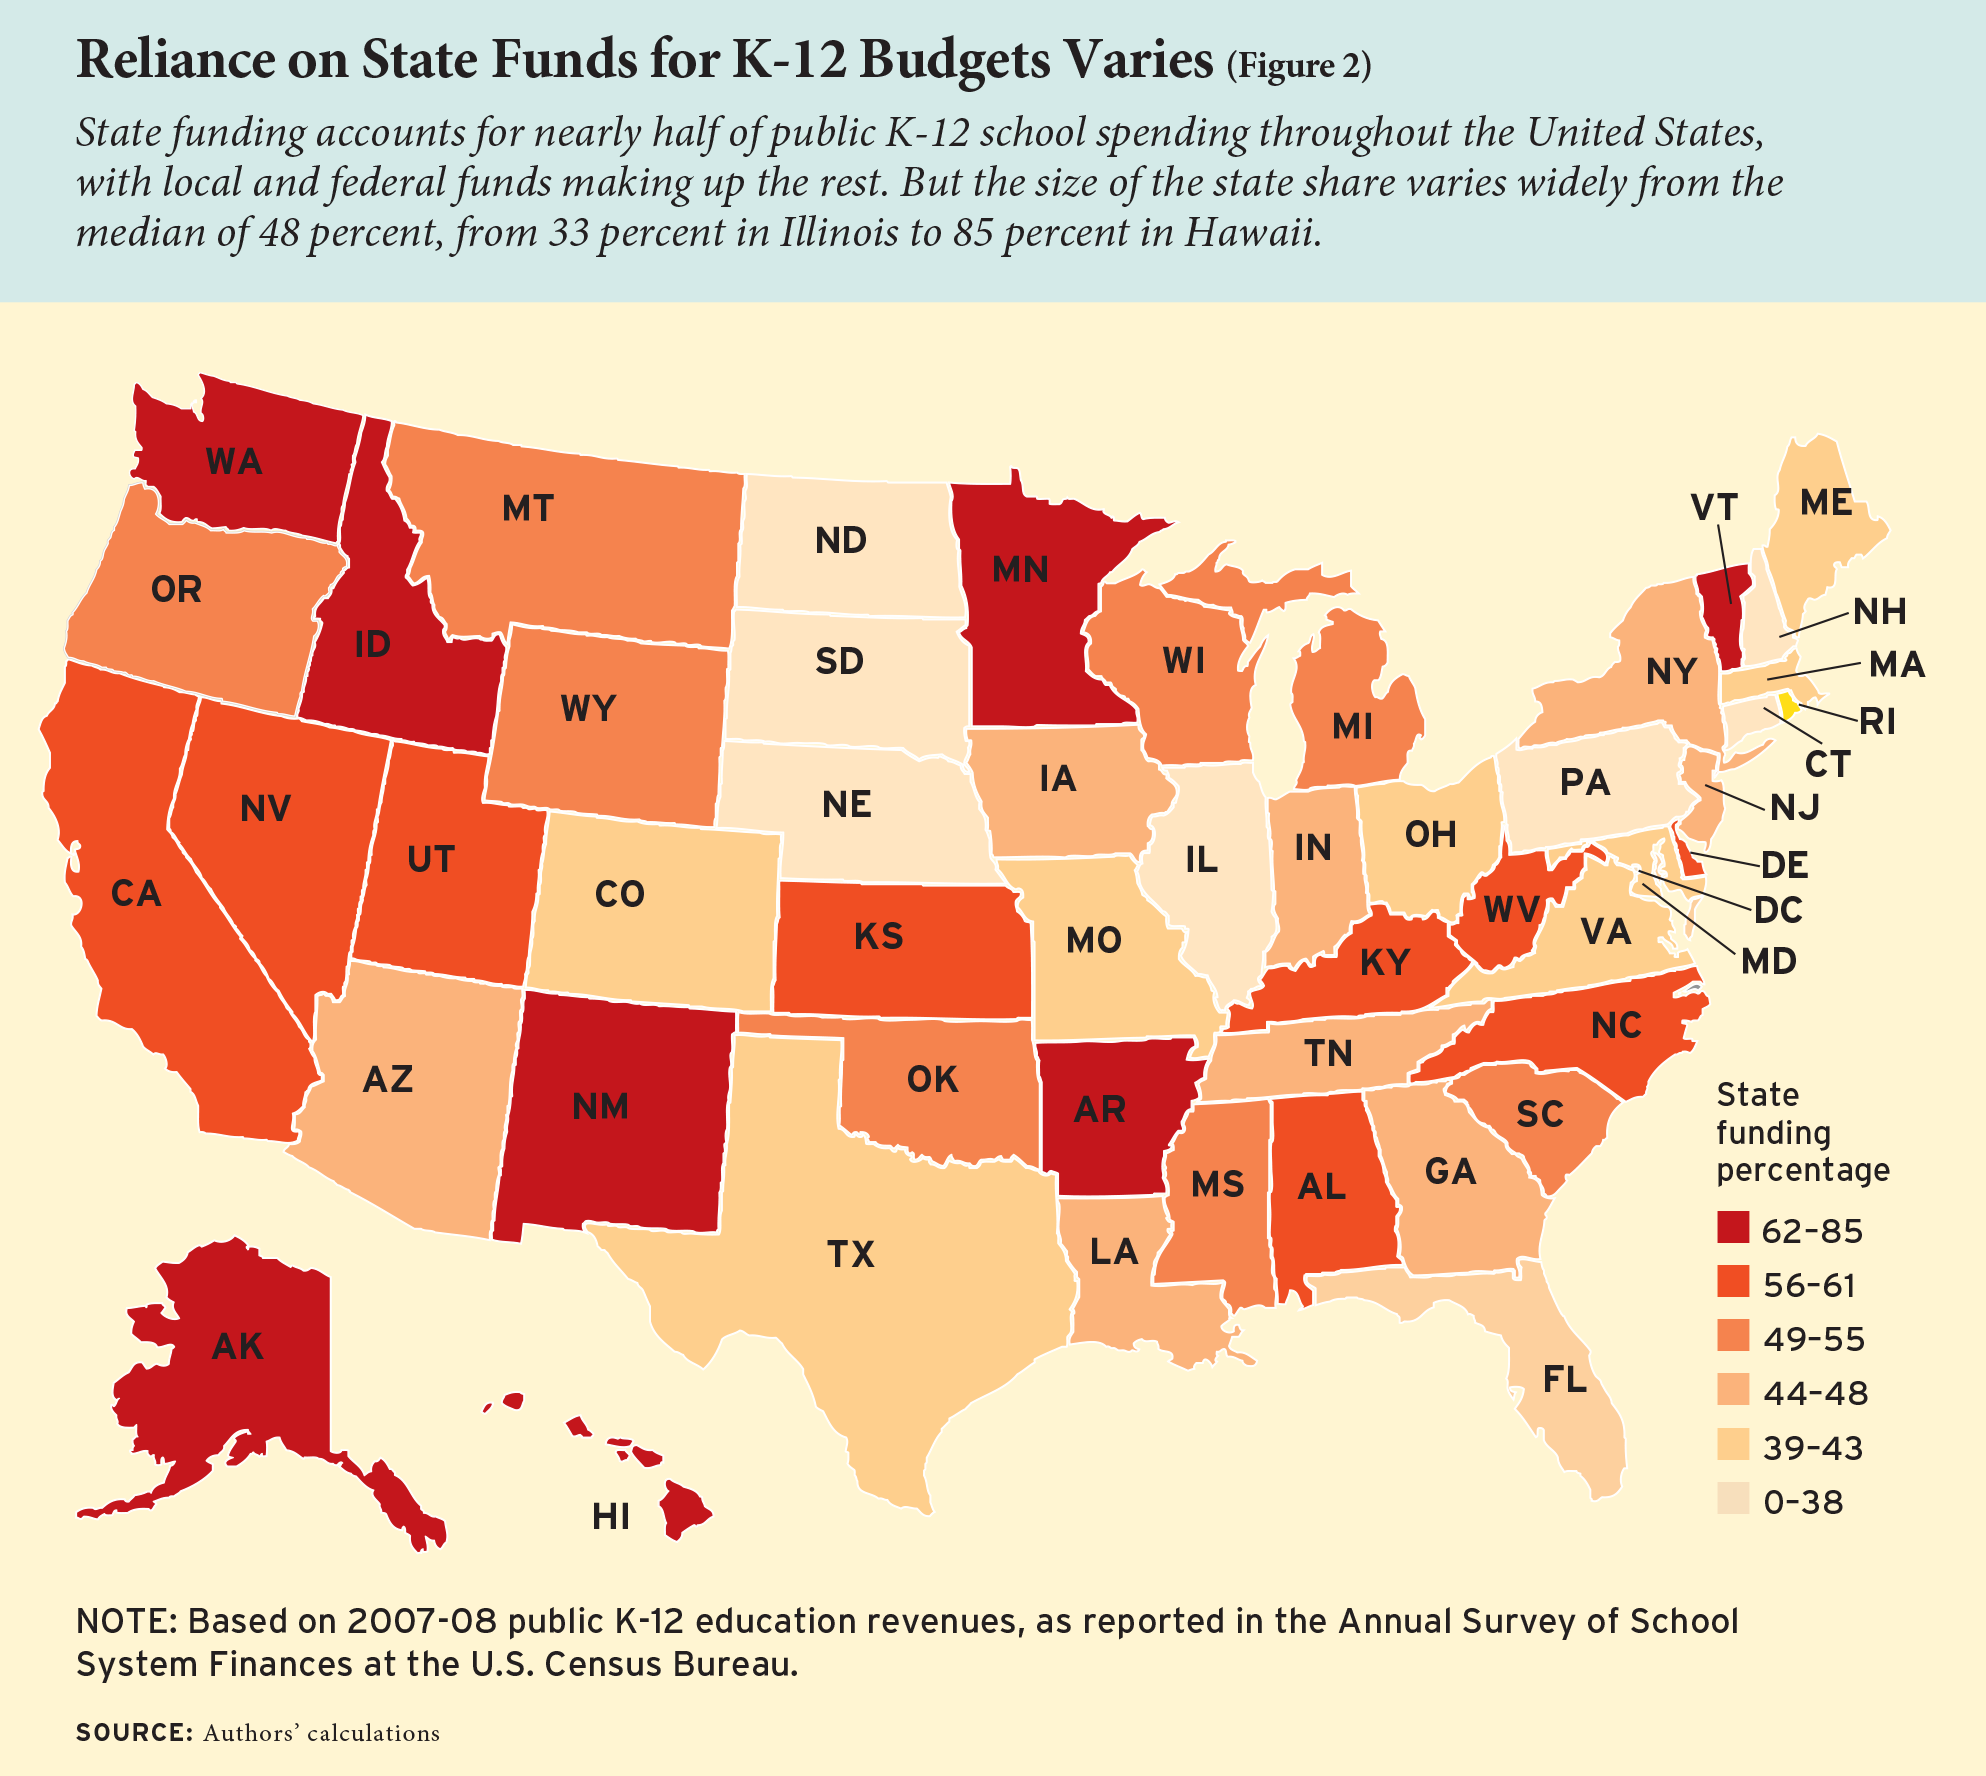
Different states have different levels of vulnerability to these effects (see Figure 2). One example of a highly vulnerable state is Hawaii. In 2008, schools in Hawaii received 85 percent of their funding from the state, and 75 percent of state revenues came from income or sales taxes. Its education spending was therefore highly sensitive to both the crowd-out and revenue effects. By contrast, school spending in a state like Illinois is less vulnerable. In 2008, schools in Illinois received only 33 percent of their funding from the state. As a result, local school budgets were, on average, far less sensitive to the business cycle.
While overall school spending declined after the onset of the recession, revenues from state taxes fell most sharply through both the crowd-out and revenue channels. Because of this, states that were more reliant on state revenues to fund public education in 2008 due to the particulars of their school-funding formulas tended to experience larger school spending reductions during the recession.
In our main analysis, we compare the changes in outcomes after the recession across states that were more or less reliant on state revenues and therefore experienced larger or smaller reductions in school spending. To illustrate our approach, in Figure 3 we consider states to be “more reliant” if state revenues accounted for 48 percent or more of their K–12 education spending in 2008. We then examine how per-pupil spending in those states changed, on average, after 2008, relative to each state’s own pre-recession trend in school spending. Next, we conduct the same analysis in “less reliant” states. Figure 3a plots the difference in these changes in per-pupil spending between the two groups. The downward trend after 2009 confirms that states that were more reliant on state revenues to fund public education saw larger declines in school spending after the recession.
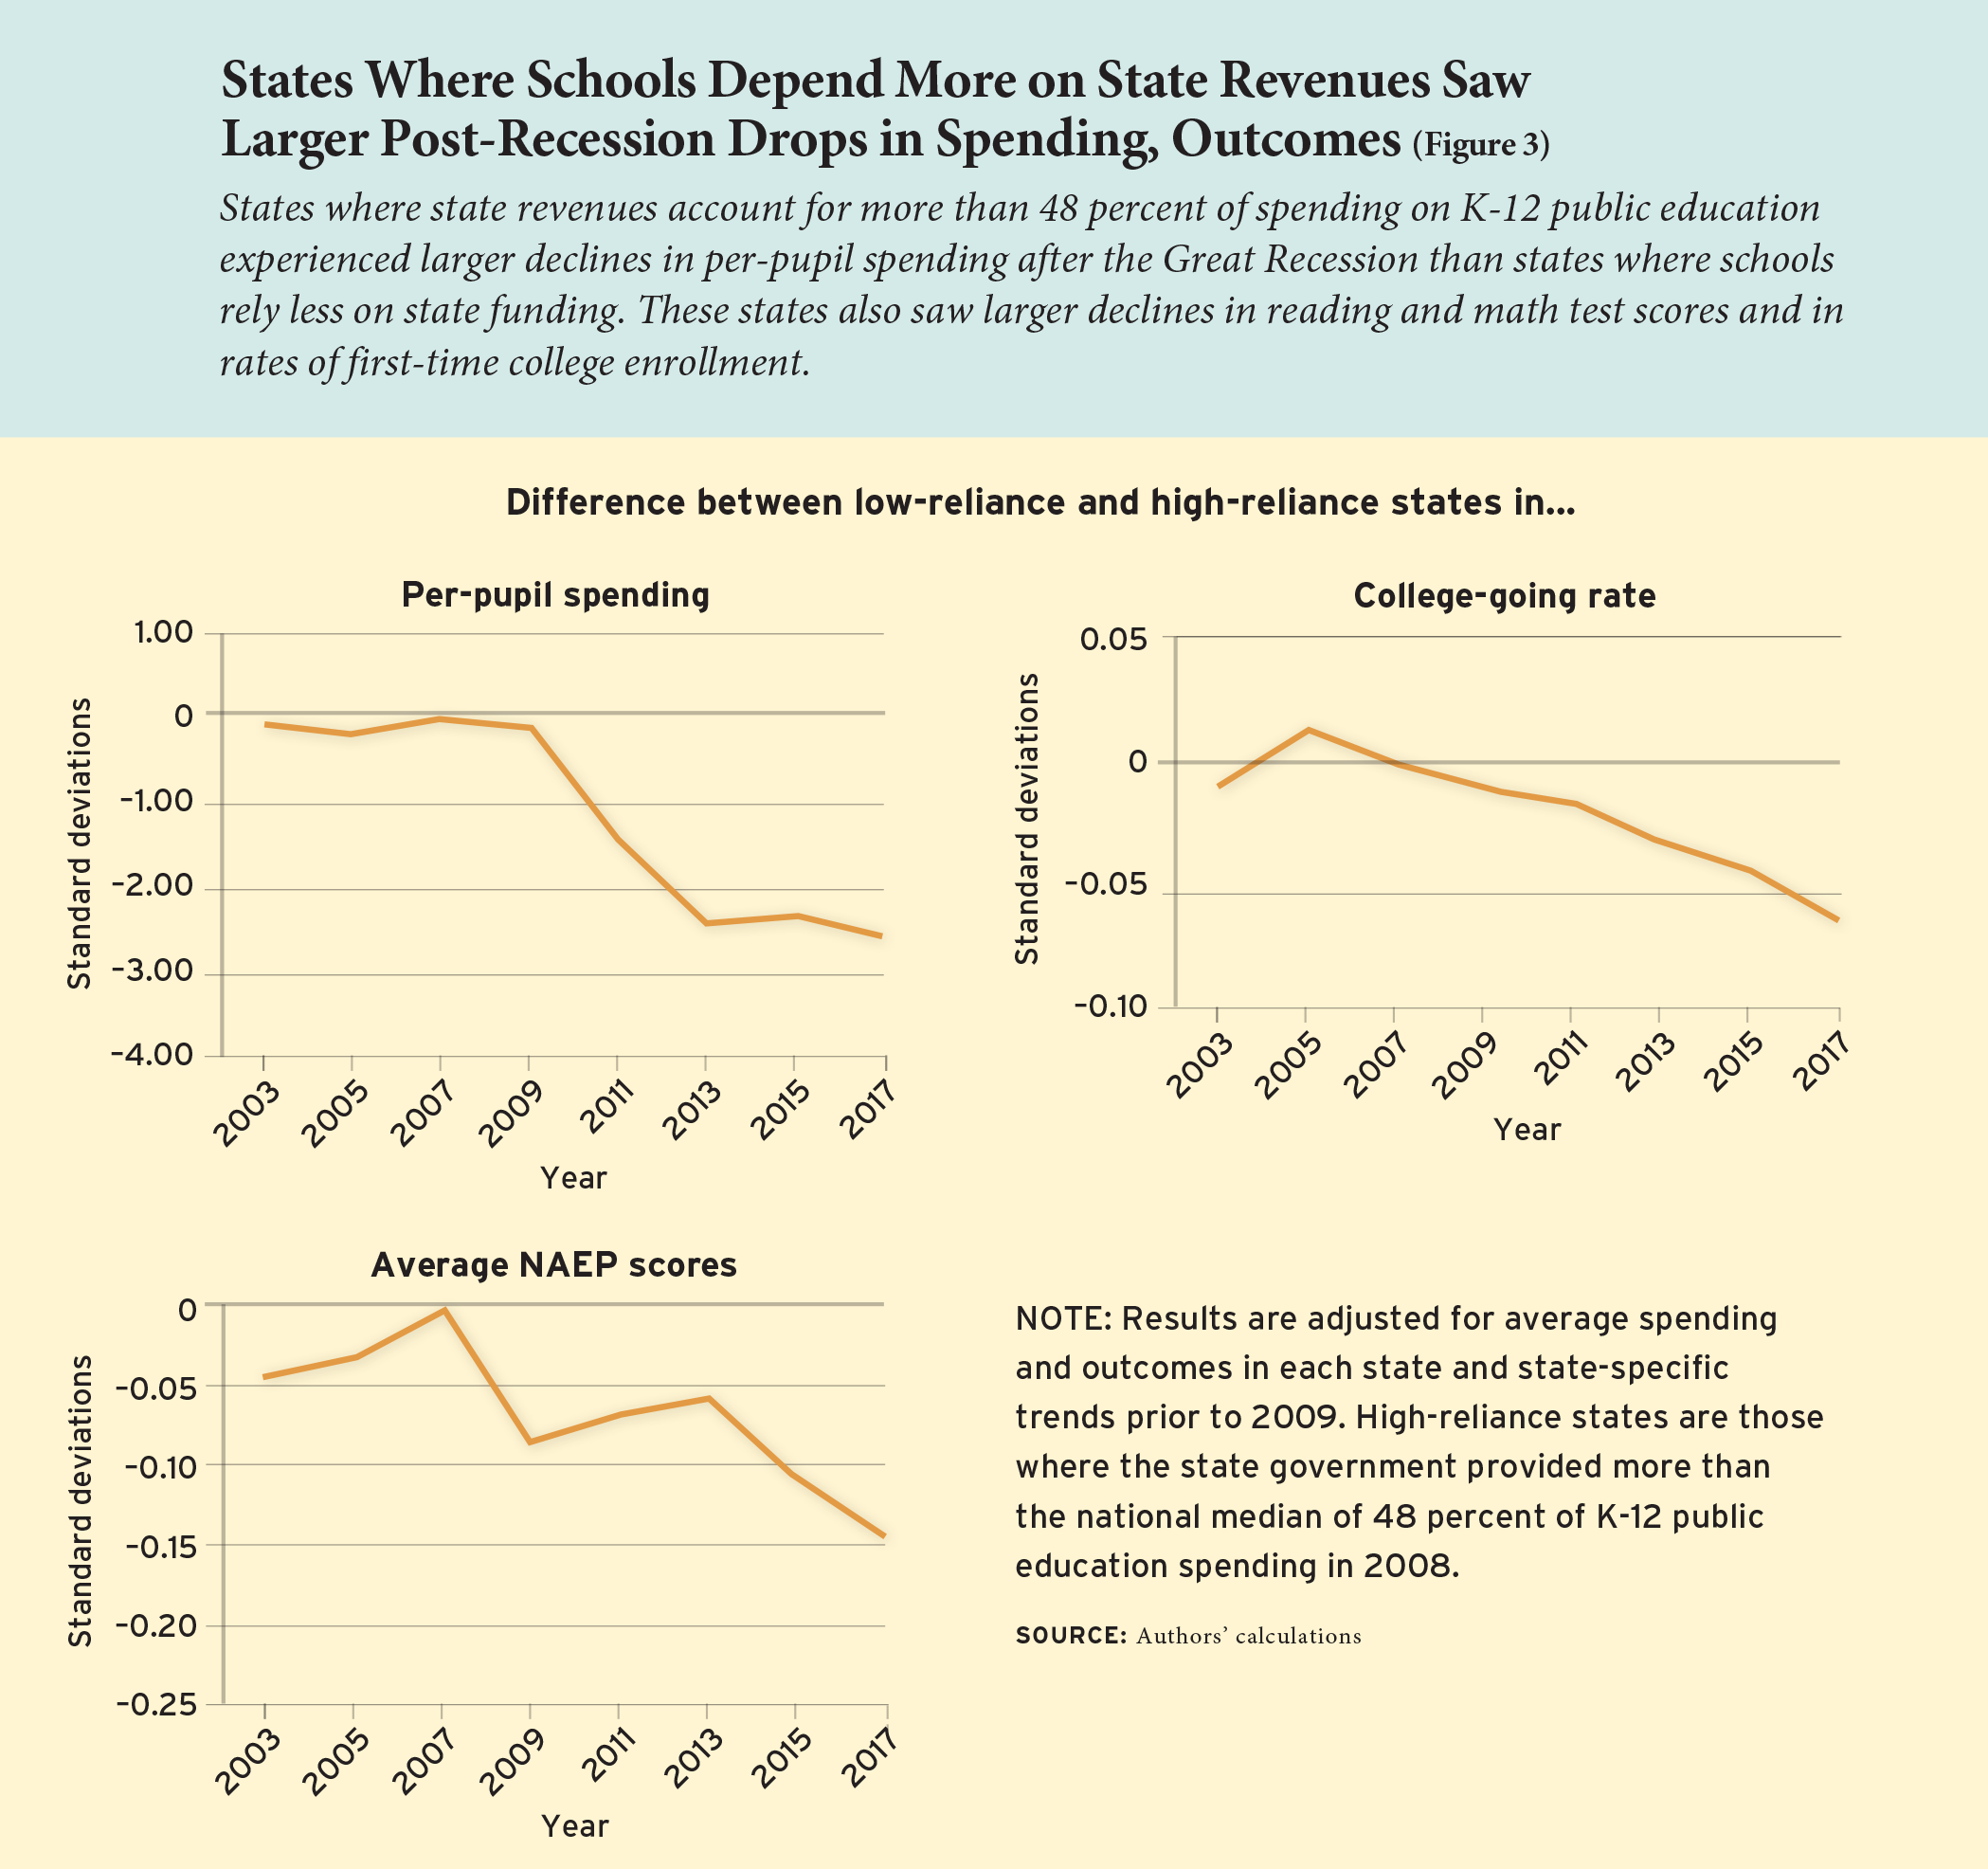
We then use the same grouping of states and method to compare changes in students’ average test scores (see Figure 3b) and likelihood of enrolling in college (see Figure 3c). If school spending affects outcomes, the trend in spending should correspond with the trend in test scores and college-going. This is what we find.
Our main analysis uses this same basic logic. We study the relationship between reliance on state funding, post-recession changes in school spending, and student achievement across states. We predict how much a state’s school spending would be expected to change based on its prior reliance on state funding and study the effects of those predicted changes on student outcomes. We find no evidence of a relationship between reliance on state funding and the severity of a recession. This reduces concerns that outcomes in these states would have declined for reasons other than a decline in school funding. Even so, we adjust for detailed measures of state economic conditions when estimating the effects of school spending changes on student outcomes.
Results
We find that a $1,000 reduction in per-pupil spending due to the recession led to a decline in student test scores of about 3.9 percent of a standard deviation, or about 1.6 percentile points. That $1,000 reduction also led to a decline in the college-going rate of first-time freshmen of about 1.2 percentage points, a 2.6 percent change. To better understand how these trends played out, we estimate the extent to which different budget line items shrank in response to recession-induced decreases.
On the whole, school districts responded to recession-era funding declines by cutting the largest percentage from their capital budgets. Capital costs make up about 10 percent of district budgets but account for as much as 47 percent of budget trims. By cutting more from capital, states may have been able to cut substantially less from core operating expenses, such as teachers’ salaries and benefits. Indeed, current operating costs account for 85 percent of overall spending but only about 51 percent of spending cuts.
Even so, districts still made substantial cuts to instructional spending. For every dollar in spending cuts, we find districts reduced instructional spending by $0.45, on average. Reductions in payroll costs for instructional employees account for roughly half of that amount, while reduced benefits make up most of the rest.
Districts trimmed their spending on payroll across the board, taking particular aim at the guidance office. We look at overall staff counts and find that, on average, a $1,000 decline in spending was associated with hiring 3.7 percent fewer teachers, 5.3 percent fewer instructional aides, 3.3 percent fewer library staff members, and 12 percent fewer guidance counselors. This led to roughly 0.3 more students per teacher and 80 more students per guidance counselor.
We also look at how cuts in state education funding affected students of color and students from low-income families. We first measure the relationship between a district’s poverty rate in 2007, before the recession began, and students’ test scores. On average, we find that a district where 30 percent of students are from low-income families has average test scores that are one standard deviation lower than a district in that same state that had zero poverty. We then see how the relationship between district poverty rates and test scores changed as spending fell. Our results reveal that, when per-pupil spending declines by $1,000, the test-score gap grows by about 12 percent of a standard deviation. In sum, the achievement losses caused by recessionary public-school spending cuts were disproportionately experienced by students in high-poverty districts.
In investigating the effects on students by race, we find negative effects from school spending cuts for both white and black students, and small and inconsistent effects for Hispanic students. The effects are largest for black students, suggesting that spending cuts may have increased black-white test score gaps. To test this directly, we restrict our analysis to states that enroll sufficient numbers of black and white students for their test scores to be reported publicly and compute the test-score gap in each state for each year. We find that a $1,000 spending cut would increase the gap in average test scores between black and white students by about 6 percent.
Finally, we explore how the recessionary spending cuts affected the kinds of colleges that students attend, focusing on first-time college freshmen. The decline in college enrollment caused by recessionary spending cuts was driven largely by two-year schools. Overall, a $1,000 decline in per-pupil spending reduced the rate of first-time enrollment at two-year colleges by 5.9 percent, while at four-year colleges it decreased by a statistically insignificant 1.2 percent. Enrollment at public colleges fell by 4 percent, compared to a small (and statistically insignificant) 1.7 percent increase at private colleges. We also looked at schools classified as minority-serving institutions, which include historically black colleges and universities, tribal colleges and universities, and schools that enroll large numbers of Hispanic or Asian students. These institutions experienced a 10 percent relative decline in attendance, although these estimates tend to be imprecise and are not statistically significant. Taken as a whole, these patterns suggest that the decline in college enrollment due to spending cuts reflected reduced enrollment at less selective and minority-serving institutions.
Since these college enrollment effects are driven by public institutions, one may wonder if our results reflect a tuition effect. Specifically, if those states that experienced the largest recessionary budget cuts were also likely to raise in-state tuition, it could partially explain our college-going results. To assess this possibility, we reviewed federal data on states’ higher education finances, college tuition charges, and financial aid and Pell grant receipts. We find that changes in per-pupil spending due to the recession are unrelated to states’ college tuition charges, in-state tuition, Pell grant awards, or private school tuition. In sum, we find no evidence that our college-going effects are driven by a tuition effect.
Spending Cuts Matter
Ever since 1966, when the Coleman Report first raised the question, policymakers and scholars have debated whether public school spending matters for student outcomes. There is a growing consensus that money can matter. But there has been no study to date looking at how schools respond to large funding cuts and how cuts affect student outcomes. Our results confirm that that money matters in education and provide new evidence that school spending cuts matter as well.
We show that declining state support and subsequent cuts in local school budgets can slow student progress with potentially lasting consequences. First, the spending declines that followed the Great Recession halted a five-decade-long increase in student test scores in reading and math, kicking off what some have called a “lost decade” in terms of student achievement. Second, those cuts also were associated with slower rates of college-going among students on track to become first-time college freshmen, possibly undermining some students’ momentum during a critical moment of transition from K–12 to higher education. These consequences are evident despite the federal American Recovery and Reinvestment Act of 2009, a stimulus program that partially offset education spending cuts. Its funds were insufficient to fully offset the losses, though they likely helped reduce the severity of cuts in the years immediately following the recession.
More than a decade later, some of the education spending cuts linked to the Great Recession have yet to be fully restored. In the pandemic era, as we face another impending recession and constrained state budgets, the years ahead appear likely to include further cuts. Federal stimulus funding may be necessary to help prevent similar detrimental effects on student achievement.
Further, given that the consequences of cutting public education spending are long-lasting, states facing a series of difficult financial decisions may wish to prioritize restoring education budgets as soon as possible after the recovery. Though the impact of tough economic times on public schools may be felt for years to come, the severity of the consequences for students can be minimized by maintaining support for instruction as much as possible.
C. Kirabo Jackson is professor of human development and social policy at Northwestern University, where Cora Wigger is a PhD candidate. Heyu Xiong is assistant professor at Case Western Reserve University. This article is adapted from a study titled “Do School Spending Cuts Matter? Evidence from The Great Recession” forthcoming in the American Economic Journal: Economic Policy.
The post The Costs of Cutting School Spending appeared first on Education Next.